
Published in: Journal of Pharmaceutical and Biomedical Analysis 15(11) (1997) 1667-1678.
D.Dumanovic, I. Juranic *, D. Dzeletovic, V.M.Vasic ** and J. Jovanovic
ICN Galenika Institute, 29. Novembra 111, 11000, Belgrade, Yugoslavia,
*Faculty of Chemistry, University of Belgrade, P.O.Box 158, 11001 Belgrade, Yugoslavia,
**Institute of Nuclear Sciences "Vinca", Department of Chemistry, P.O.Box 522, 11001 Belgrade,
Yugoslavia
Abstract
The prototropic exchange equilibria of two drugs, nizatidine (I) and ranitidine (II), and also of
structurally related the N,N-dimethyl-2-nitro-1,1-ethenediamine molecule (III) were
investigated. From the changes in electronic spectra in media of various acidity several
protonation constants were determined. For nizatidine pK values were 0.82, 1.95, and 6.67; for
ranitidine pK values were 1.95 and 8.13; and for III was 2.60. The hydroxylation equilibrium
constant in strongly alkaline media was determined too. Corresponding pKa values were 13.23
for I, 13.26 for II, and 13.76 for III. Molecular orbital calculations of electronic spectra
confirmed that pK 1.95 for I and II, and pK 2.60 for III, are associated with C-protonation of
nitroethenediamine fragment, while all pKa values correspond to the addition of HO anion at the
same double bond.
Keywords: Nizatidine, Ranitidine, N,N'-dimethyl-2-nitro-1,1-ethenediamine, Protolytic
constants, UV Spectra, MNDO-PM3 and ZINDO/S calculations
Introduction
Nizatidine, N-[2-[[[2-[(dimethylamino)methyl]-4-thiazolyl]methyl]thio]ethyl]-N-methyl-2-nitro-1,1-ethenediamine (I) and ranitidine, N-[2-[[[5-[(dimethylamino) methyl]-2-furanyl]
methyl]thio]ethyl]-N-methyl-2-nitro-1,1-ethenediamine (II) are selective H2-receptor
antagonists and powerful inhibitors of gastric acid secretion introduced for the treatment of
peptic ulcers and related disorders [1-4]. The first synthesis of ranitidine was reported in 1978
[5] and nizatidine in 1983 [6]. These two drugs are structurally related, and differ in the type of
heterocyclic ring. A key feature of both structures is N,N-dialkyl-2-nitro-1,1-ethenediamine
moiety [7], since nizatidine (I) contains the thiazolyl, while ranitidine (II) contains the furan ring
(Scheme 1). To make the clear distinction between the effects of two moieties, the N,N-dimethyl-2-nitro-1,1-ethenediamine molecule (III) was investigated too.

Scheme 1
Besides the medical importance of nizatidine and ranitidine, these compounds offer a challenging structural problem of the determination of the reactivity of various sites suitable for prototropic exchange.
The pKBH+ values for the protonation process of nizatidine [8] and ranitidine [9], which occur in neutral media (pH 6-8) have been determined potentiometrically [8,9]. The protonation constant on a 2-nitroethenediamine moiety of nizatidine [8] as well as of ranitidine [9-11] was determined spectrophotometrically [8-11]. In this paper, the study of protolytic equilibria was extended to include the spectrophotometric and theoretical investigations of the protolytic processes in aqueous, in sulphuric acid aqueous solutions and in alkaline media.
For the molecular orbital calculations of the ground-state geometries the PM3-MNDO method was used [12], as most accurate, particularly for the nitro compounds. All the calculations were done on the compound III. Due to the complex structure of this compound there are certain ambiguities in the assignment of the measured spectra to the particular ionic form. Using ZINDO/S MO method, spectra of III and at various ionic species derived from it were calculated. The calculated approximate spectra are used to make definite assignments of measured spectra.
The knowledge and use of prototropic exchange equilibria and stereoelectronic properties of
pharmacologically important subunits of drugs is profoundly important for successful analytical
procedures, for the selection of optimal conditions for synthesis, isolation, and purification. It is
essential in the realm of pharmaceutical technology, pharmacokinetics, clinical medicine, etc.
Experimental
Materials.- Nizatidine (CAS No. 76963-41-2) (I), supplied from ICN Galenika (Belgrade,
Yugoslavia), ranitidine (II) hydrochloride (CAS No. 66357-59-3) , obtained from Zdravlje
(Leskovac, Yugoslavia) and N,N-dimethyl-2-nitro-1,1-ethenediamine (CAS No. 54252-45-8)
(III), product of Uquifa (Barcelona, Spain), were used without further purification. Substrate
stock solutions of 1103 M were prepared in water. The concentrations of substrates for the
determination of pK values were 4105 - 2104 M. The other chemicals (H2SO4, NaOH) were
of reagent grade quality. The acidity of the solutions in the pH range 2 - 12 was adjusted by
addition of Britton-Robinson buffer. The acidity of concentrated H2SO4 solutions was
characterized by Hammett acidity function, Ho [13]. The basicity of concentrated NaOH
solutions was described using J function [14].
Spectroscopic and pH measurements.
UV spectra were recorded, immediately after preparing the solutions, on a spectrophotometer
Shimadzu UV Model 260. The concentration of sulfuric acid was determined from the density
measured at 25 C, using the precise density meter. Acid solutions of various acid concentration
were made by diluting H2SO4 to obtain desired acidity. To check the possible existence of the
non-protolytic processes, the absorption spectra were recorded again after 1 hour standing and
no changes were found. On the subsequent dilution of solutions in 8 M H2SO4 and in 5 M
NaOH, the spectra were identical to those of the control solutions in dilute acids or in neutral
media.
Method of Computation
Ground state structures of III and ions derived from it were calculated by MNDO-PM3
semiempirical molecular orbital method [12], included in MOPAC program package, Version
7.01. The simulation of polar medium was performed using COSMO facility. The calculation
of electronic transitions was done with ZINDO/S program. Configurational space for the excited
state calculations was formed of all monoexcitations up to 20 eV cutoff energy.
Results and discussion
Absorption spectra
The absorption spectra of the compounds I - III were recorded in water solutions of the various acidity, from 8 M H2SO4 to 5 M NaOH.
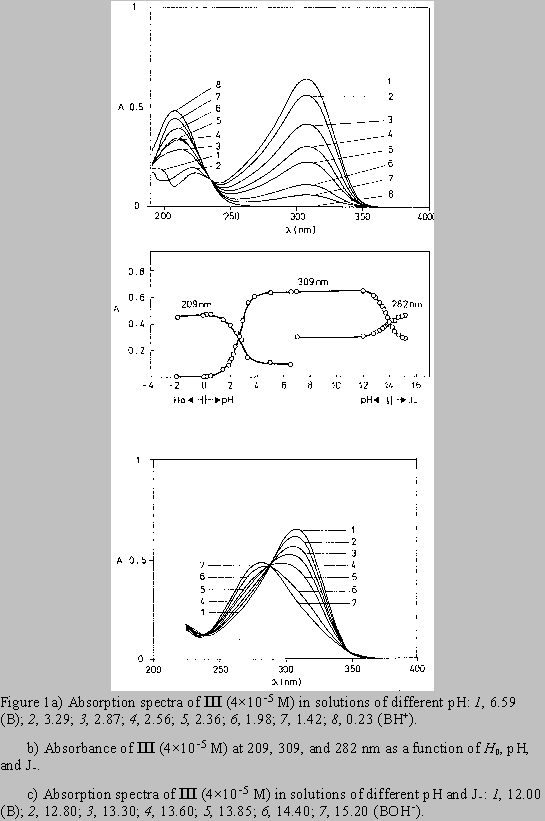
The absorption spectra of the model substance III in neutral media show the absorption bands with the maxima at 223 and 309 nm (Fig. 1). In acidic solutions (pH 5 to 0) the protonation of 2-nitroethenediamine moiety caused the hypsochromic shift of the absorption maximum from 223 to 209 nm while the absorption maximum at 309 nm disappeared (Figs. 1a,b). With the increasing NaOH concentration up to 5 M, the longer wavelength maximum was shifted hypsochromically from 309 to 282 nm (Figs. 1b,c).
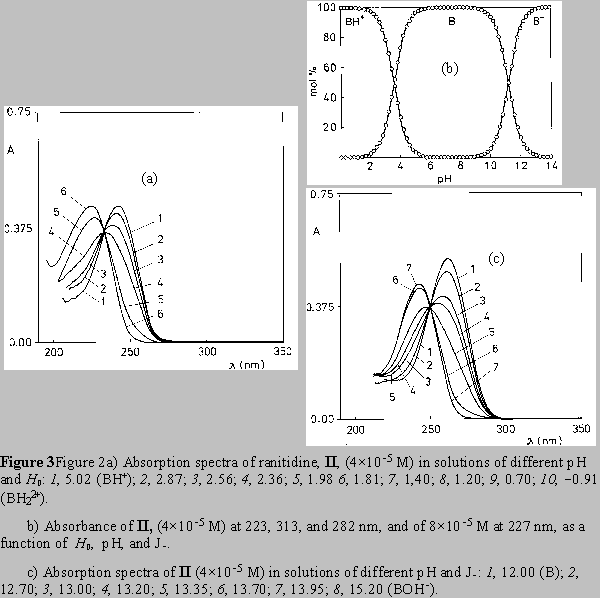
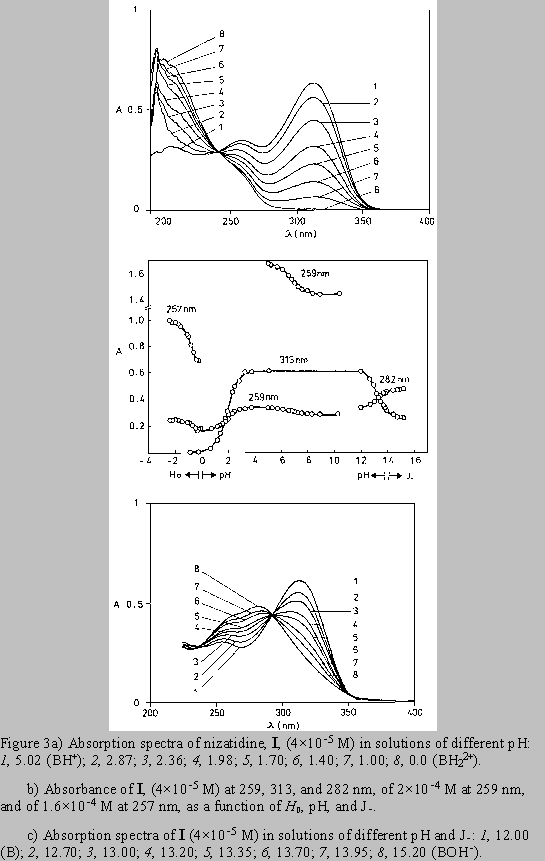
The absorption spectra of ranitidine (Fig. 2) and nizatidine (Fig. 3) in aqueous solutions (pH 4 - 11) show two main absorption bands. The short wavelength maximum at 227-259 nm stems mainly from the heterocyclic ring chromophore, with the contribution from the 2-nitroethenediamine chromophore. The other one has main absorption at 313 nm. The absorption spectra of both drugs in acidic media (pH 4 to 0) show the changes similar to the change exerted by III. Disappearance of the absorption band at 313 nm, assignable to the substituted conjugated 2-nitroethenediamine chromopohore, is followed by the increase in intensity and by the hypsochromic shift of the short wavelength maximum, at 223 nm for ranitidine (Figs. 2a,b), and 207 nm for nizatidine (Fig. 3a). The increase of pH from 11 to PH 15.5, leads to the hypsochromic shift of the other absorption maximum from 313 to 282 nm (Figs. 2b,c and 3b,c); again the behavior similar to that of III.
For the three compounds studied the spectral changes exert clear isosbestic points: in acidic solutions at 242 nm( I), 243 nm (II), 235 nm (III), and in alkaline solutions at 238 and 292 nm (I), 240 and 292 nm (II), 238 and 288 nm (III). Corollarly, these protolytic processes involve the same reaction sites on 2-nitroethenediamine moiety.
By increasing pH from 4 to 10 the compounds I and II show the spectral changes that are minute but visible. The decrease of the intensity of the absorption at 259 nm of I (Figs.3b /upper curve/, and 4) and at 227 nm of II (Fig 2b /upper curve/), was accompanied by the appearance of the clear isosbestic points and hypsochromic shift of the absorption maximum.
The increase of acidity from pH 0 to H0 3, decreases the absorption of component I at 257 nm
(Fig. 3b, Fig. 5).
| Table 1. Heats of formation calculated by MNDO-PM3 and spectral transitions (calculated by ZINDO/S) for N,N-dimethyl-2-nitro-1,1-ethenediamine, III, and ionic species derived from it. | |||||
| Structure | Hf / kcal mol1 | Spectral transition wavelengths
( nm ) (calculated oscillator strengths are given in parentheses) | |||
| in vacuum | in water | in vacuum | in water | ||
 |
III | 1.656 | 28.455 | 192 (0.538)
200 (0.137) 206 (0.237) 314 (0.455) |
193 (0.636)
200 (0.145) 205 (0.183) 313 (0.382) |
 |
IIIa | 170.853 | 89.260 | 188 (0.226)
300 (0.998) |
188 (0.217)
293 (0.285) 308 (0.743) |
 |
IIIb | 175.299 | 88.079 | 180 (0.527)
208 (0.149) 211 (0.147) 267 (0.302) |
172 (0.475)
177 (0.162) 182 (0.184) 207 (0.137) 215 (0.172) 269 (0.284) |
 |
IIIc | 158.250 | 81.840 | 187 (0.358)
191 (0.418) 215 (0.196) |
190 (0.653)
194 (0.107) 221 (0.280) |
 45 45 |
IIId | 247.106 | 167.527 | Partial geometry optimization was done (CH bond angle vas not optimized). See discussion. | |
 |
IIIe | 156.521 | 90.233 | 173 (0.220)
237 (0.273) 294 (0.923) |
202 (0.159)
205 (0.426) 320 (0.713) |
 |
IIIf | 72.293 | 141.745 | 201 (0.472)
205 (0.120) 247 (0.241) 673 (0.198) |
202 (0.428)
204 (0.130) 257 (0.239) 448 (0.113) 661 (0.222) |
 |
IIIg | 97.912 | 153.042 | 208 (0.277)
247 (0.562) |
207 (0.303)
259 (0.281) 269 (0.137) |
 |
IIIh | -49.443 | 127.493 | 170 (0.172)
207 (0.331) 307 (0.779) |
220 (0.159)
205 (0.426) 320 (0.713) |
 |
IIIi | 20.446 | 107.351 | 344.96 (0.154)
264.19 (0.345) 221.67 (0.216) 204.23 (0.339) |
302.31 (0.290)
265.13 (0.259) 208.98 (0.184) 195.07 (0.216) |
Molecular orbital calculations
The results of the molecular orbital calculations are summarized in Table 1. Details on various conformers of III, are not given, because of their close resemblance to the results previously obtained by MNDO-AM1 method [15]. The structures IIIa - IIIe represent all the possible protonated forms of III. (The full geometry optimization was not performed for structure IIId. If bond angle of new CH is not constrained it ends as structure IIIc.) In the reference [9] very convincing evidences in favor of C-protonation were given. The calculations confirm it. The calculations both on isolated and on solvated ions reveal rather low heats of formation for two C-protonated species, IIIc and IIId and O-protonated species IIIe. The semiempirical MNDO-PM3 calculation shows that IIId can not exist. Distinction between IIIc and IIIe is clearly detectable in UV spectra. Only the electronic transitions calculated for IIIc conform to the experimental spectrum, because IIIe should have considerable absorption at longer wavelengths.
Anionic species can be produced either by the proton abstraction (IIIh and IIIi) [9], or by the
hydroxyl anion addition (IIIf and IIIg). The calculations show that IIIf has the lowest heat of
formation. The key feature of the UV spectral changes in alkaline solutions of III is
hypsochromic and hypochromic shifts of the long wavelength peak. Again, the calculated
electronic transitions for IIIg most closely fit the observed effect. This structure is already
suggested in the literature [16], and we hope that our calculations bear the conclusive evidence
for it.
The ionic forms and calculation of protolytic constants
The changes in the absorption spectra due to the variable media acidity, are the consequences of
the changed ionic form of the compound. The absorbance vs. acidity curves were produced for
the investigated acidity range. Table 2 summarizes the pH and intervals of the acid
concentrations where no change of the absorbance takes place (optimal pH for particular
molecular species), together with the wavelength and molar abseorptivity of the peak absorption
of the corresponding molecular species.
Table 2. Spectral characteristics of nizatidine (I), ranitidine (II) and
N,N-dimethyl-2-nitro-1,1-ethenediamine (III) molecular species.
| Compound | ionic form | optimal acidity | max
(nm) |
104
(mol1 dm3 cm1) |
| Nizatidine | BH33+ | H0 = 2.5 - 3.0 | 207
257 |
1.70
0.67 |
| BH22+ | pH = 0.0 - 0.5 | 207
257 |
1.84
0.50 | |
| BH+ | pH = 4.0 - 5.1 | 259
313 |
0.87
1.59 | |
| B | pH = 9.5 - 11.5 | 255
313 |
0.77
1.59 | |
| BOH- | J = 15.2 - 15.4 | 262
282 |
1.10
1.23 | |
| Ranitidine | BH22+ | H0=1.0 - pH = 0.0 | 223 | 2.15 |
| BH+ | pH = 4.0 - 6.0 | 227
313 |
1.73
1.65 | |
| B | pH = 10.3 - 11.5 | 227
313 |
1.63
1.66 | |
| BOH | J = 15.2 - 15.4 | 227
282 |
1.55
1.26 | |
| III | BH+ | pH = 0.0 - 0.3 | 209 | 1.20 |
| B | pH = 5.0 - 11.5 | 223
309 |
0.45
1.59 | |
| BOH | J = 15.2 - 15.4 | 282 | 1.20 |
Taking into accounts that there are different basic sites, the multiple protonation equilibria in the acidity range from pH 10 to 8 M H2SO4 occur:
![]() (1)
(1)
 (2)
(2)
The protonation constant, K1, of the dimethyl amino group for compounds I and II was well established and determined by potentiometric titration [8,9]. Although the spectral changes in the acidity range from pH 5 to pH 10 were small, the pK1 values of monoprotonated molecules I and II have been calculated from the dependence of the absorbance vs. pH curves at several wavelengths according to the known spectrophotometric method [17].
pK = pH + log I (3)
 (4)
(4)
where A0 and A1 are the absorbancies of the pure forms of the compounds. The
spectrophotometrically obtained results agree very well with the potentiometric data [8,9] (Table
3).
Table 3 The pK values of nizatidine (I), ranitidine (II) and N,N-dimethyl-2-nitro-1,1-ethene- -diamine (III), determined spectrophotometrically.
| Ionic form | Reaction site | pKn | pK | ||
| Nizatidine | Ranitidine | III | |||
| BH33+ | heterocyclic ring | pK3 | 0.820.07 | ||
| BH22+ () | 2-nitroethenediamine | pK2 | 1.950.02
2.1 [8] |
1.950.01
2.3 [9] 2.190.04 [10,11] |
2.600.02 |
| BH+ | dimethyl amino group | pK1 | 6.670.01
6.80* |
8.130.05
8.20# |
|
| BOH | 2-nitroethenediamine | pKa | 13.230.02 | 13.260.04 | 13.760.02 |
For compound III this is actually BH+ due to lack of dimethyl amino group.
* Value 6.80 was found by potentiometric titration [8].
# Value 8.20 was found by potentiometric titration [9].
The pK2 values of I - III were determined from the absorbance vs. pH curves in the acidity range from pH 0 to 5 according to the equation 3, and their values are mutually related in the manner expected from structural differences. This agreement suggests that the second protonation process on I and II must be assigned to the 2-nitroethenediamine moiety.
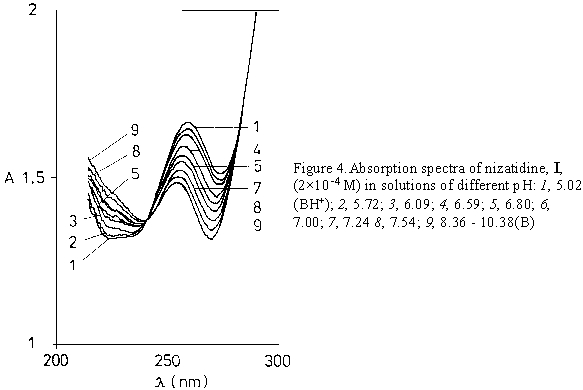
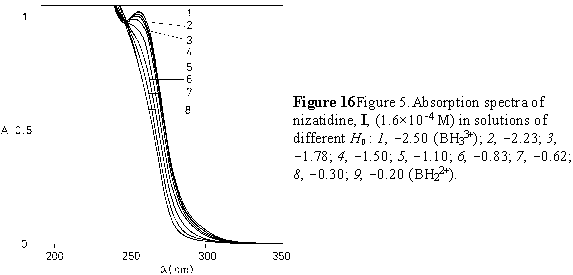
The variation of nizatidine absorbance in a highly acidic media is shown on Figure 4. The value of the protonation constant of the nitrogen atom in a thiazole ring of I (pK3) was calculated using the excess acidity method based on the following equation [18]:
![]() (5)
(5)
The values for log CH+ and X are independent of the base present and are taken from the literature data for each H2SO4 concentration [18].
The spectroscopic studies of ranitidine in alkaline solutions show that ranitidine, as a weak acid, is completely dissociated in 5 M sodium hydroxide [9]. This protolytic constant has not been accurately measured but suggested that it is of the magnitude 1014. Presumably, proton loss is from nitrogen, although why it leads to a hypsochromic shift was not clear [9]. However, the report on the investigation of hydrolytic cleavage of ranitidine under strongly basic conditions at reflux temperature [16] was suggested that hydrolytic cleavage occurs via hydroxy ion attack on the -carbon atom of the 2-nitroethenediamine moiety.
The equilibrium 6 represents the addition of a hydroxyl ion that can occur at pH > 12:
B + OH BOH (6)
 (7)
(7)
The symbol B represents a very weakly acidic molecule having no net charge.
For addition of hydroxyl ions (eq. 6) the acidity function J has been defined [13,14] as:
 (8)
(8)
where pKa = pKOH + pKw; pKw denotes a negative logarithm of the dissociation constant of water. To calculate values of pKa by means of equilibrium 8, the value of log I was determined from spectrophotometric measurements at varying sodium hydroxide concentrations.

The pK values for the two drugs, nizatidine and ranitidine, and for the model substance III are summarized in Table 3. The differences found between the successive pKn values are large enough to justify the assumption in the treating of experimental data that protonation steps take place one at a time.
The Scheme 2 shows three steps of protonation equilibria, and the process of the addition of a hydroxyl ion on nizatidine.
The structures d and c in Scheme 2 are easily characterized by UV absorption maximum at 310 nm that is found in uncharged forms of II and III too. The transition c b is characterized by the disappearance of this absorption maximum at approx. 310 nm, implying a major structural change. Some authors [19,20] have proposed a proton exchange resembling the transition III IIIi. The computed properties of various molecular species, given in Table 1, are clearly against such proton exchange. In common terms, the CH dissociation in highly acidic medium is not probable. It is well known fact that anionic species have much higher reduction potential than corresponding cation, and experimental facts show clear decrease of reduction potential at lower pH. All the effects described in the literature [19,20] are easy to explain by involvement of intermediate IIIc. This is also consistent with the finding that nitrosation of a nitroethenediamine moiety occurs preferentially at a carbon atom [21].
The prototropic exchange b a may involve protonation on several places: oxygen in a nitro group, amine nitrogen in ethenediamine moiety, and nitrogen in a thiazole ring. The lack of analogous protonation in ranitidine suggests that this metathesis is related to the presence of a thiazole ring.
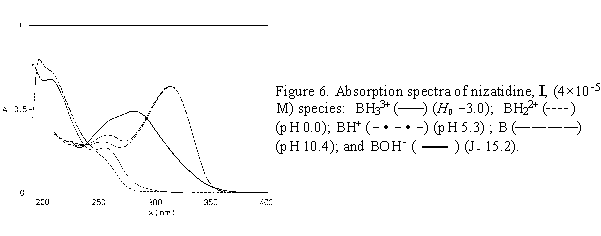
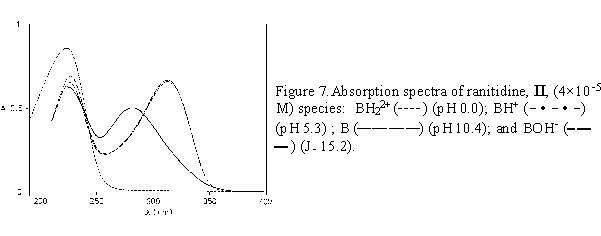
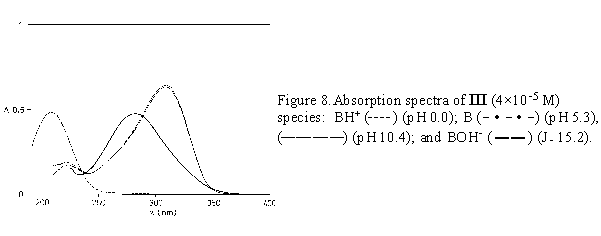
Once the pK value is determined, the H0, pH, or J of the medium could be chosen to obtain the maximal concentration of the corresponding molecular species. For nizatidine, ranitidine and compound III, spectra of pure molecular species taken at appropriate acidity values are given in Figures 6 - 8.
The knowledge of correct pK values of pharmaceuticals has a profound pharmacological
relevance, enabling the preparation of most stable and most efficient formulations. The results
presented in this work show that spectrophotometric titration coupled with MO calculations offer
accurate method for the identification of ionic species derived from complex organic molecules.
References
[1] R.N. Brogden, A.A. Carmine, R.C. Heel, T.M. Speight and G.S.Avery, Drugs 24, 267-303 (1982).
[2] J. Dawson, R.Cockel, G.T. Dixon, D.A. Richards, and R. Stables, J. Clin. Hosp. Pharm. 8, 1-13 (1983).
[3] M.J. Daly and B.J. Price, Prog. Med. Chem. 20, 337-368 (1983).
[4] A.H. Price, and R.N. Brogden, Drugs 36, 521-539 (1988).
[5] B.J. Price,J.W. Clitherow and J. Bradshaw (Allen and Hanburys Ltd.), Ger. Offen. 2.734.070, 09. Feb.1978; Brit Appl. 76/32.465, 04 Aug.1976 83 pp.; Chem.Abstr. 88 190.580b (1978).
[6] R.P. Pioch (Lilly, Eli and Co.) U.S. 4.382.090, 03 May 1983, U.S. Appl. 193.192, 02 Oct. 1980, 23 pp. Cont.- in part of U.S. 4.375.547; Chem. Abstr. 99 43548w (1983).
[7] S. Rajappa, Tetrahedron 37, 1453-1480 (1981).
[8] T.J. Wozniak, Anal. Profiles Drug Subst. 19, 397-427 (1990).
[9] T.J. Cholerton, J.H. Hunt, G. Klinkert and M. Martin-Smith, J. Chem. Soc., Perkin Trans. 2, 1761-1776 (1984).
[10] M. Hohnjec, S. Rendic, T. Alebic-Kolbah, F. Kajfes, N. Blazevic and J. Kuftinec, Acta Pharm. Jugosl. 31, 131-142 (1981).
[11] M. Hohnjec, J. Kuftinec, M. Malnar, M. Skreblin, F. Kajfes, A. Nagl and N.Blazevic, Anal. Profiles Drug Subst. 15, 534-561 (1986).
[12] J.J.P. Stewart, J. Comp.-Aided Molec. Des. 4, 1-105 (1990).
[13] C.H.Rochester, in Acidity Functions, Academic Press, pp.22-36, London, New York (1970).
[14] W.J.Bover and P. Zuman, J. Am. Chem. Soc. 95, 2531-2536 (1973).
[15] R.D.Enriz and E.A.Jauregui, J. Mol. Struct. (Teochem) 207, 269-283 (1990); R.D.Enriz and E.A.Jauregui, Acta Cient. Venez. 42, 70-76 (1991); R.D.Enriz, G.M. Cinffo, M.R. Estrada, and E.A.Jauregui, Acta Cient. Venez. 39, 214-223 (1988).
[16] P.A. Haywood, M. Martin-Smith, T.J. Cholerton and M.B. Evans, J. Chem. Soc., Perkin Trans. 1, 951-954 (1987).
[17] A.G. Asuero, M.J. Navas and J.L. Jimenez-Trillo, Talanta 33, 195-198 (1986).
[18] R.A.Cox and K.Yates, J. Am. Chem. Soc. 100, 3861-3867 (1978).
[19] P. Richter, M.I. Toral and F. Munnoz-Vargas, Analyst 119, 1371-1374 (1994).
[20] A. Sega, R. Toso, V. Sunjic, L. Klasinc, A. Sabljic and D. Srzic, Gazz. Chim. Ital. 111, 217-222 (1981).
[21] T.J. Cholerton, J. Clitherow, J.H. Hunt, J.W.M. Mackinnon, M. Martin-Smith, B.J. Price, J. Murray-Rust and P. Murray-Rust, J. Chem. Res. (S) 250-251 (1985); J. Chem. Res. (M) 2818-2846 (1985).